Using d3.js to visualize GIS
I've been playing around with d3.js a bit the last couple of days and it's a great little javascript library to visualize information. I needed a simple library to easily create a SVG element from a couple of paths stored in postgis. This library will transfom this set of coordinates (in WGS84) to an SVG that can be directly rendered in your browser.
I really like the example they showed here:
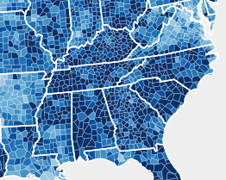
So I wanted to recreate this, but then based on a set geo paths (shape format) I downloaded from http://www.cbs.nl. After some messing around I only had to do the following:
- Convert and read in the shape files in postgis.
- Make sure the coordinates were transformed from the RD format used in the Netherlands to WGS84.
- Export this information from postgis in geo-json format.
- Use d3.js to create SVG nodes using the mercator projection.
- Scale and transform the SVG to center on the Netherlands
Convert the shape files and read into postgis
You can do this very easily using the shp2pgsql command:
/opt/local/lib/postgresql91/bin/shp2pgsql -W ISO-8859-1 Bevolkingskern_2008_def.shp geodata.kernen > Bevolkingskern_2008_def.sql
This will create a simple SQL file you can read into postgis.
Convert the coordinates to the correct EPSG projection. If you know the source projection and the target projection you can easily do this using postgis:
ST_Transform(ST_SetSRID(the_geom,28992),4326))
When I loaded the information in postgis I didn’t specify which projection was used (which SRID). So before I can covert it I first have to explicitly set the SRID we’re working with. In this case its SRID 28992, which tells postgis that our data in the database is stored in Rijks Driehoek format. Then with the ST_Transform operation we convert to SRID 4326 which is WGS84, and which we can use in our mercator projection.
Export to geo-json
The next step is to get the information in a format we can use. D3.js expects the data in the geo-json format. Luckily postgis also supports this format. If we expand the query we just saw, we get the following to get a set of geo-json ready data:
SELECT gm_naam,ST_AsGeoJson(ST_Transform(ST_SetSRID(the_geom,28992),4326)),
		                          		bev_dichth,aant_inw,aant_man,aant_vrouw,
		                          		p_ongehuwd,p_gehuwd,p_gescheid, p_verweduw
		                          		FROM geodata.gem
With this select statement I retrieve some general information from the database (jn this case some census information for all the municipalities in the Netherlands) and I retrieve the geo coordinates as geo-json. We almost got the format we want to sent to d3.js. We just need to wrap the geo-json string in another json element to get this:
{
  "type": "FeatureCollection",
  "features":   [
        {
      "type": "Feature",
      "bev_dichth": "364",
      "gm_naam": "Gennep",
      "geometry":       {
        "type": "MultiPolygon",
        "coordinates": [[        [
                    [
            5.951878,
            51.742153
          ],
                    [
            5.9547286,
            51.73854
          ],
                    [
            5.9590716,
            51.73852
          ],
           ....
Use d3.js to show and scale the geo information
Now we can load this json structure in d3.js and show the map:
var xym = d3.geo.mercator();
var path = d3.geo.path().projection(xym);

// the variable that holds our translate, centers on the netherlands
var translate = xym.translate();
translate[0] = -500;
translate[1] = 10640

// center on the netherlands and zoom all the way in
xym.translate(translate);
xym.scale(60000);

var svg = d3.select("#chart")
    .append("svg").attr("id","svgoriginal");

var gemeentes = svg.append("g")
    .attr("id", "gemeentes")
    .attr("class", "RdYlGn");

d3.json("geoinformation.json", function (json) {
    gemeentes.selectAll("path")   // select all the current path nodes
        .data(json.features)      // bind these to the features array in json
        .enter().append("path")   // if not enough elements create a new path
        .attr("class", quantize)  // add attribute class and fill with result from quantize
        .attr("id", named)
        .attr("d", path)          // transform the supplied jason geo path to svg
});
And that’s pretty much it. The result of this exercise is the following svg map of the Netherlands.
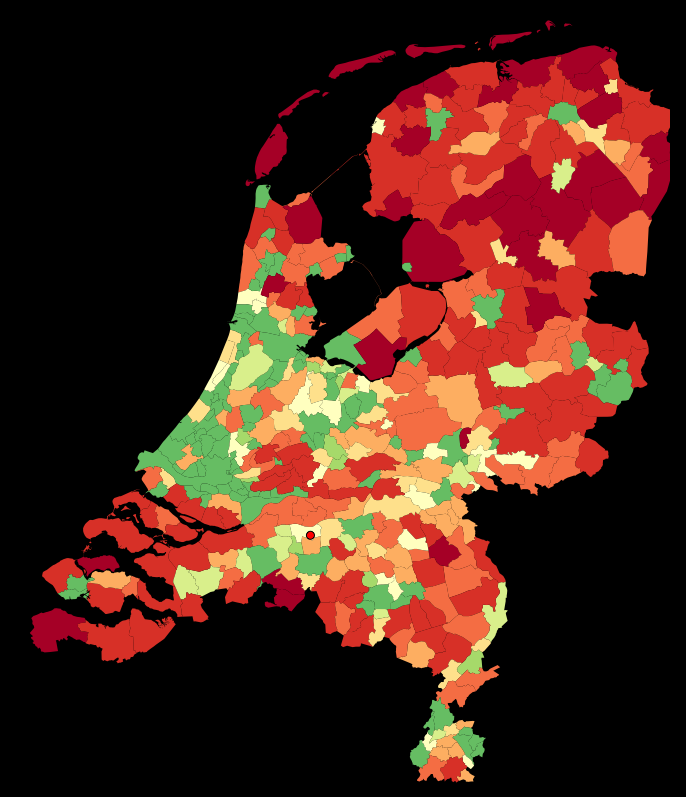
The interesting aspect is that everything is standard SVG, so you can very easily attach mouselisteners, use css and javascript for effect, and pretty much do everything with these element you can do with other elements in the DOM tree!